Economic Affairs, Vol. 65, No. 1, pp. 97-105, March 2020
DOI: 10.30954/0424-2513.1.2020.13
©2020 EA. All rights reserved
Analysis of Energy Input Use Efficiency in Punjab Agriculture
Hardeep Kumar*, Arjinder Kaur and Preet Kamal Singh Bhangu
Department of Economics & Sociology, Punjab Agricultural University, Ludhiana, Punjab, India
*Corresponding author: harryrampal86@gmail.com ( ORCID ID: 0000-0002-9093-7176)
Received: 12-09-2019
Revised: 04-01-2020
Accepted: 20-02-2020
ABSTRACT
The present study measured the energy efficiency at various sizes of farms in relation to their energy use pattern with special reference to wheat and paddy crops in relevance to electricity and fertilizer efficiency, identified the factors responsible for levels of efficiency on Punjab Farms and given the implications for future energy demand scenario and usage pattern in Punjab agriculture. A significant decline in per hectare use of commercial and non- commercial energy with the rise in the level of efficiency was observed. Per hectare use of commercial and non-commercial energy was comparatively low in zone III to zone I and zone II. Per hectare use of both commercial and non-commercial energy was more in paddy crop as expected in comparison to wheat crop. Paddy alone consumes three-fourth of total electricity consumption in agriculture. Only 20 per cent decrease in area under rice cultivation would decrease the energy use to a great extent. So, there is also a need of shifting from present wheat-paddy cropping system to less energy intensive cropping system.
Highlights
 Percent use of non- commercial energy at all levels of efficiency decreased with the increase in the size of farms.
Fertilizer plus agrochemicals and electric motor plus diesel engine were the major source of commercial energy used on Punjab farms.
Keywords: Commercial and non commercial energy use, per hectare, paddy, wheat
Enhanced inputs of energy and improvements in its quality have played a key role in the development of all technologies including those associated with agriculture production. Agricultural productivity and consumption of commercial energy based inputs in the agricultural sector in Punjab are relatively high. The problem of energy, particularly, the depletion of non-renewable resources, kept engaged the attention of scientists, planners and research workers for quite some time in the past. Efforts have been made to study various aspects of its application in different fields and also to devise ways and means to meet the challenges of its increasing demand. Some useful work has also been done on different energy aspects in the field of agriculture. Efficiency is expressed as the ability to produce the outputs with a minimal required resource level (Sherman, 1988). In production, efficiency is a normative measure and is defined as the ratio of weighted sum of outputs to inputs ratio. The weights for inputs and outputs are estimated to the best advantage for each unit so as to maximize its relative efficiency. In order to measure the optimal input/ output, it is mandatory to first specify the production frontier (Mukherjee, 2008). The consumption pattern of both direct and indirect sources of commercial energy was analysed using time series data from 1980-81 to 2006-07 to explain the direction and the extent of energy-use in Indian agriculture (Jha, 2012). On the basis of commercial and non-commercial classification the main sources of commercial energy are coal, hydro and nuclear power while the non-commercial forms of energy are firewood, agricultural wastes and animal dung etc. Among the renewable energy sources, agricultural wastes can play a vital role for meeting the large scale energy requirements of different sectors of the economy (Energy statistics of Punjab 2015-16).
How to cite this article: Kumar, H., Kaur, A. and Bhangu, P.K.S. (2020). Analysis of energy input use efficiency in Punjab agriculture. Economic Affairs, 65(1): 97-105.
Efficient use of energy resources in agriculture is one of the principal requirements for sustainable agricultural production as it provides financial savings, fossil resources preservation and air pollution reduction and attempts should be made to raise the production yield or to sustain the energy input without affecting the output in order to enhance the energy efficiency (Singh et al. 2004). Therefore, energy saving has been a vital subject for sustainable development in agricultural systems. Improvement of energy efficient agricultural systems with low input energy compared to the output of food can reduce the greenhouse gas emissions from agricultural production systems.
Development in the efficiency of resource use in agriculture requires the definition of spatial and temporal use of current resources as well as development of tightly defined and broadly suitable indices (Topp et al. 2007). In some studies the indicators of output energy to input energy ratio and energy productivity in crop production systems have been used to evaluate the performance of farmers. Energy productivity is an important indicator for more efficient energy usage although higher energy productivity does not mean more economic feasibility (Mohammadi et al. 2010). The energy input-output analysis is usually made to measure the energy efficiency and environmental aspects. This analysis determines efficiency of energy to be used. In current years, several researches have been conducted on energy use for production of different agricultural crops (Jianbo, 2006; Meul et al. 2007 and Kizilaslan, 2009).
The importance of energy use efficiency has increased as the share of commercial energy use in total energy utilization has increased manifold. The problem of measuring productive efficiency at farms has become important to both the economic theorists and policy makers. If the theoretical argument that some farmers are relatively more efficient than others is subjected to empirical testing then it becomes all the more important to make some actual measurement of efficiency. Hence new technologies should be developed and transferred to farmers. However, for farms operating at lower levels of efficiency, sufficient potential also exists for improving the productivity of rice by proper management and allocation of the existing resources and technology (Samarpitha et al. 2016). Therefore, there is need to access these energy trends in agriculture and to know how far can farms increase their output simply by increasing their efficient utilization of the given resources.
Punjab State is viewed as the most prosperous state in India. With the passage of time, Punjab farmers started using more and more of commercial energy and became highly energy intensive. So, it becomes the need of the hour to study the energy use pattern in Punjab agriculture with a view to check on the appropriate/ excessive use of energy on the farms. So, the present study was undertaken to examine the energy use efficiency of different inputs in Punjab agriculture with special reference to wheat and paddy crops.
METHODOLOGY
The study focuses on the energy input use pattern and its efficiency in the agricultural sector of the Punjab state.
The primary data has been collected from three agro- climatic zones of Punjab i.e. Sub- mountainous zone, Central plain zone and South- western zone. The data has been collected for the period 2014- 15 of principal crops in Punjab.
Punjab state is divided into following three crop homogenous zones on the basis of soil type, cropping pattern, irrigation, rainfall and temperature.
♦Zone I (Sub - mountainous zone): Wheat, paddy and maize area.
♦Zone II (Central plain zone): Wheat, paddy, potato and oilseeds area.
♦Zone III (South - Western zone): Wheat, paddy and cotton area.
Multistage random sampling techniques have been used for the selection of the sample households, six districts in all have been selected randomly, comprising two districts from each zone at the first stage of sampling. At the second stage, two blocks from each selected district have been randomly selected and two villages have been randomly selected from the each block in the third stage. Thus 24 villages have been selected from the entire state for the purpose of study. From each selected village, fifteen farmers have been selected randomly. From each village, four small, seven medium and four large farmers have been taken purposely based on the size of their operational holding. Thus, the ultimate sample consists of 360 farms. For the present study, five farm size categories were regrouped into three as under:
Size limits of farm with category of size group
Collection of Data
The data on 360 sample farms have been collected for the period 2014- 15. The detailed data on farm input use were collected which has been utilized to develop Best Practice Productivity Frontier for measuring the efficiency of farms. The data were collected for all the major crops namely wheat, paddy, maize, potato, cotton, and sarson. The data have been collected on the following parameters:
1.Area under the crops and the total cropped area (hectares).
2.Human labour (hours): family, permanent worker and casual.
3.Tractor used (hours): owned and hired.
4.Irrigation: power used with electric motor/ diesel engine (kwh)
5.Thrashing: type of thrashing and its quantity (hours).
6.Seed: quantity (kg)
7.Fertilizer: quantity of NPK (kg)
8.Agro-chemicals (kg)
9.Production: quantity of main product and by product (quintals).
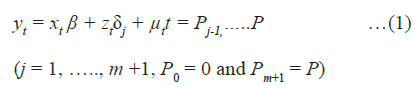
In this study, using a Cobb- Douglas functional form, the production function model used and the definition of variables considered are described as under:
Where,
Y = Yield in (q/ha)
X1 = human labour (MJ)
X3 = Seed used (MJ)
X4 = Fertilizer + agrochemicals (MJ)
X5 = Tractor+ thrashing (MJ)
X6 = Power used for irrigation with electric motor / diesel engine (MJ)
ao = constant term
u = error term
b1 through b6 are the regression coefficients for X1 through X6, respectively.
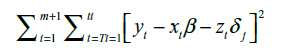
The efficiency level of an individual farm is defined by the following expression;
[exp(-Ui)]
1-[Qi/Qi*]
Where Qi* is the maximum possible output, and Qiiis the actual output.
The study has utilized the energy equivalence of different items of inputs to agricultural production and of main products from published information by School of Energy Studies for Agriculture, Punjab Agricultural University, Ludhiana (Index I).
Index I Energy Equivalence of Inputs:
1. Commercial
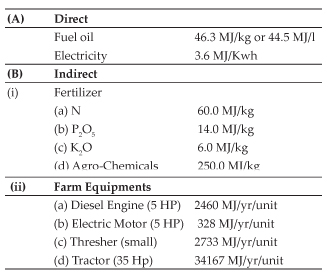
2. Non-Commercial
*Source: School of Energy Studies for Agriculture, PAU, Ludhiana; MJ: Mega Joules (1 × 10⁶ Joules)
RESULTS AND DISCUSSION
Energy Efficiency Analysis
The study attempted to use the Best Practice Frontier Efficiency Model to work out the efficiency of farms using various energy inputs. The various crop outputs were converted into energy through appropriate energy transforms. Both main products and by- products were converted into energy output using energy equivalents. This facilitated the adding up of various outputs and their byproducts. Similarly various inputs were converted into their energy equivalents. The entire data was thus transformed into their energy equivalents. The energy inputs were further divided by the area cropped and also by the energy output. This provided us with various energy inputs used for production of one unit of energy output per hectare. For want of generalized algorithms of multifactor analysis to arrive at efficiency ratio the energy inputs were classified into two categories.
1.Non-commercial energy inputs
(a)Human labour
(b)Seed
2.Commercial energy inputs
(a)Fertilizer + agrochemicals
(b)Machines used
(c)Electric motor + Diesel engine (irrigation)
In order to present the comparison of different sizes of farms with regard to their efficiency level and energy use pattern, per hectare use of energy in MJ was calculated for different sources of energy for three groups of the farmers representing different levels of efficiency. The efficiency of all the farmers was measured as already discussed in methodology. This ranged between zero per cent to 100 per cent (Table 1). These farmers were classified in three groups according to their efficiency level.
Table 1: Classification of the farmers in different groups on the basis of efficiency score
The analysis was done for small, medium and large farms functioning at three levels of efficiency zone- wise. As already discussed, energy supplied through various sources i.e. human labour and seed was classified as non- commercial energy whereas fertilizer plus agrochemicals, machinery and electric motor plus diesel engine (irrigation) as commercial energy. The results are presented in the different zones for three groups of farmers i.e. small, medium and large at three levels of efficiency in the tables.
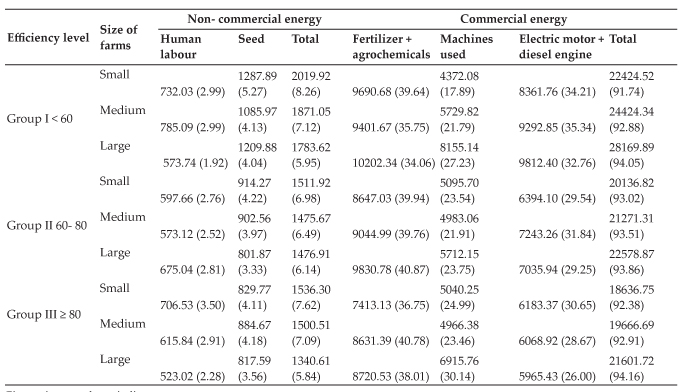
In zone I (Table 2), it was observed that percent use of non- commercial energy decreased with the increase in the farm size whereas percent use of commercial energy increased with increase in the farm size. The seed energy constituted a significant part of total non- commercial energy use. The energy used through fertilizer plus agrochemicals and electric motor plus diesel engine constituted a major part of the total commercial energy used on farms in this zone. Per hectare use of human labour on medium and large farms in group I, on large farms in group II and on small farms in group III was low on account of more use of machine energy on these farms.
The energy use per hectare varied significantly between different levels of efficiency and also according to the size of farms. Table 2 reveals that while moving from lower level of efficiency to higher level of efficiency, as expected, per hectare use of non- commercial and commercial energy inputs decrease.
Table 2: Energy used per hectare from different sources at different levels of efficiency on small, medium and large farms (Zone I) (MJ/ha), 2014-15
Figures in parentheses indicate percentage.
Table 3: Energy used per hectare from different sources at different levels of efficiency on small, medium and large farms (Zone II) (MJ/ha), 2014-15
Figures in parentheses indicate percentage.
Table 3 represents that percent share of noncommercial energy went on declining and that of commercial energy increased (except in few cases) while moving from small to medium to large farms at each level of efficiency. In zone II, the share of commercial energy was greater compared to zone I and zone III on account of cropping pattern in favour of crops consumed more commercial energy.
Similarly in zone II, out of commercial energy use, the share of electric motor plus diesel engine and fertilizer plus agrochemicals was greater and almost same among different categories of farms at different levels of efficiency. The energy used through tractor plus thrashing also constituted a greater part of the total energy used. Per hectare use of commercial energy increased while moving from small size of holding to large size holding. While moving from lower efficiency group to higher efficiency group, per hectare use of commercial energy decreased with the increase in size of farms which was very much expected. As far as noncommercial energy inputs concerned, the percent share of non- commercial energy was comparatively low in zone II to zone I.
Zone III analysis also indicated that per hectare use of commercial and non- commercial energy was different at each level of efficiency according to the size of farms (Table 4). The energy used through human labour constituted a greater part followed by seed out of non- commercial energy use. The share of fertilizer plus agrochemical energy was more pronounced as compared to other commercial energy inputs. In zone III, per hectare use of noncommercial energy was low as compared to zone II and zone I due to different cropping pattern among the zones. Moreover, per hectare use of commercial energy inputs was low in zone III as compared to zone I and zone II. Table also reveals that while moving from lower level of efficiency to higher level of efficiency and from small to medium to large farms, percent share of commercial energy increased and that of non- commercial energy decreased.
Table 4: Energy used per hectare from different sources at different levels of efficiency on small, medium and large farms (Zone III) (MJ/ha)
Figures in parentheses indicate percentage.
It was observed in Table 5 and 6 that per cent use of non- commercial at all levels of efficiency decreased with the increase in the size of farms whereas the percent use of commercial energy increased with the increase in the farm size for wheat and paddy crops in Punjab. Moreover, commercial energy constituted a significant part of total energy in both the crops. Further, the per hectare use of energy for different sources of energy inputs indicated that the energy used per hectare varied significantly between levels of efficiency and also according to size of farms in wheat and paddy cultivation in Punjab. Per hectare use of commercial and non- commercial energy decreased with the increase in the level of efficiency from small to medium to large farms except in one case in wheat crop on medium farms (1014.20 MJ/ ha) in the efficiency group III (Table 5). Per hectare use of commercial and non- commercial energy was greater on rice crop as compared to wheat and that was very much expected as rice crop required more energy inputs to wheat crop. Both fertilizer plus agrochemicals and electric motor plus diesel engine energy use played significant role in total commercial energy use.
Table 5: Energy use per hectare from different sources at different levels of efficiency on small, medium and large farms for wheat crop in Punjab (MJ/ ha), 2014-15
Figures in parentheses indicate percentage.
Table 6: Energy use per hectare from different sources at different levels of efficiency on small, medium and large farms for paddy crop in Punjab (MJ/ ha), 2014-15
Figures in parentheses indicate percentage.
Table 7 shows that contribution of these energy inputs indicated that in the class of non-commercial energy inputs, seed contributed the most in zone I whereas fertilizer contribution was the highest of the commercial energy inputs.
Seed contributed to the extent of 6.95, 6.27 and 4.97 per cent on small, medium and large farms respectively in zone I. Contribution of noncommercial energy inputs declined with the increase in size of the farms in zone I i.e. 9.50, 8.62 and 6.90 per cent on small, medium and large farms respectively. The contribution of commercial energy inputs increased with the increase in size i.e. 90.50, 91.38 and 93.10 per cent on the three different sizes of farms in zone I. In zone II, 93.10, 94.57 and 95.76 per cent contribution of commercial energy inputs was observed in small, medium and large farms respectively. Similarly, the contribution of commercial energy input increased with increase in size i.e. 92.26, 93.08 and 94.21 per cent was on small, medium and large farms respectively, in zone III.
CONCLUSION
The energy use per hectare varied significantly between different levels of efficiency and also according to the size of farms. While moving from lower level of efficiency to higher level of efficiency, as expected, per hectare use of non- commercial and commercial energy inputs decreased. In zone III, per hectare use of non- commercial energy was low as compared to zone II and zone I due to different cropping pattern among the zones. Per hectare use of commercial energy inputs was low in zone III as compared to zone I and zone II. From lower level of efficiency to higher level of efficiency and from small to medium to large farms, percent share of commercial energy increased and that of noncommercial energy decreased. Commercial energy constituted a significant part of total energy in wheat and paddy crops. Percent use of non- commercial energy at all levels of efficiency decreased with the increase in the size of farms whereas the percent use of commercial energy increased with the increase in the farm size for wheat and paddy crops in Punjab. Per hectare use of commercial and non- commercial energy was greater on rice crop as compared to wheat and that was very much expected as rice crop required more energy inputs to wheat crop. Fertilizer plus agrochemicals and electric motor plus diesel engine were the major source of commercial energy used on Punjab farms.
REFERENCES
Chalabi, Z.S. and Bailey, B.J. 1991. Sensitivity analysis of a non-steady state model of the greenhouse microclimate. Agricultural Forest Meteorology, 56 : 111-127.
Hamby, D.M. 1994. A review of techniques for parameter sensitivity analysis of environmental models. Environmental Monitoring and Assessment, 32 : 135-154.
Jha, G.K., Pal, S., and Singh, A. 2012. Changing energy use pattern and the demand projection for Indian agriculture. Agricultural Economics Research Review, 25 : 61-68.
Jianbo, L. 2006. Energy balance and economic benefits of two agroforestry systems in northern and southern China. Agriculture, Ecosystems & Environment, 116 : 255-262.
Kizilaslan, H. 2009. Input-output energy analysis of cherries production in Tokat Province of Turkey. Applied Energy,86: 1354-1358.
Lamoureux, J., Tiersch, T.R. and Hall, S.G. 2006. Sensitivity analysis of the pond heating and temperature regulation (PHATR) model. Aqua Engineering, 34 : 117-130.
Meul, M., Nevens, F., Reheul, D. and Hofman, G. 2007. Energy use efficiency of specialised dairy, arable and pig farms in Flanders. Agriculture, Ecosystems & Environment, 119 : 135-144.
Mohammadi, A., Rafiee, S., Mohtasebi, S.S. and Rafiee, H. 2010. Energy inputs - yield relationship and cost analysis of kiwifruit production in Iran. Renewable Energy, 35 : 1071-1075.
Mukherjee, K. 2008. Energy use efficiency in the Indian manufacturing sector: An interstate analysis. Energy Policy, 36 : 662-672.
Samarpitha, A., Vasudev, N. and Suhasini, K. 2016. Technical, Economic and allocative efficiencies of rice farms in Nalgonda district of Telangana state. Economic Affairs,61(3): 365-374.
Sherman, H.D. 1988. Service organization productivity management. The Society of Management Accountants of Canada, Hamilton, Ontario.
Singh, M., Saran, S.K. and Kaur, P. 2004. Energy use and land productivity in Punjab agriculture Indian Journal of Regional Sciences, 36 : 76-82.
Topp, C.F.E., Stockdale, E.A., Watson, C.A. and Rees, R.M. 2007. Estimating resource use efficiencies in organic agriculture: a review of budgeting approaches used. Journal of Science of Food and Agriculture, 87 : 2782-2790.
Turhan, S., Ozbag, B.C. and Rehber, E. 2008. A comparison of energy use in organic and conventional tomato production. Journal of Food, Agriculture and Environment,6: 318-321.